Uncovering Patterns and Connections with Self-tracked Data
Define
The objective was to discover correlations and insights through personally tracked data. As a runner, my aim is continual improvement in strength and speed. With running, numerous factors contribute to performance, prompting my curiosity to explore their interrelations.
Data Collection
During a span of two weeks, I meticulously collected an extensive array of data that I believed could influence my running outcomes.
At the beginning of my data collection I tracked anything I could think of that would affect my running performance and motivation. I used my Garmin running watch to collect the majority of the data and online resources to collect the weather data.
Data Analysis
The key questions I sought to answer were:
1. How did using the treadmill influence my running?
2. Did obtaining more sleep the night before result in morning runs?
3. Were there identifiable patterns in my heart rate?
At the outset of my data collection, I prioritized examining the impact of sleep. My initial hypothesis was that sleep would significantly affect my runs, yet all of the analysis suggested otherwise. As I progressed with this process, I discontinued the inclusion of sleep as a variable. As I analyzed the remaining data, I found myself particularly fascinated by three primary variables: the treadmill, heart rate, and weather. These factors appeared to have the most significant mutual influence and directly affected the distance I covered in my runs.
Design Process
Sketching
I began with rough, quick sketches to explore different concepts and layouts. These sketches were done rapidly to capture initial ideas without focusing on details.
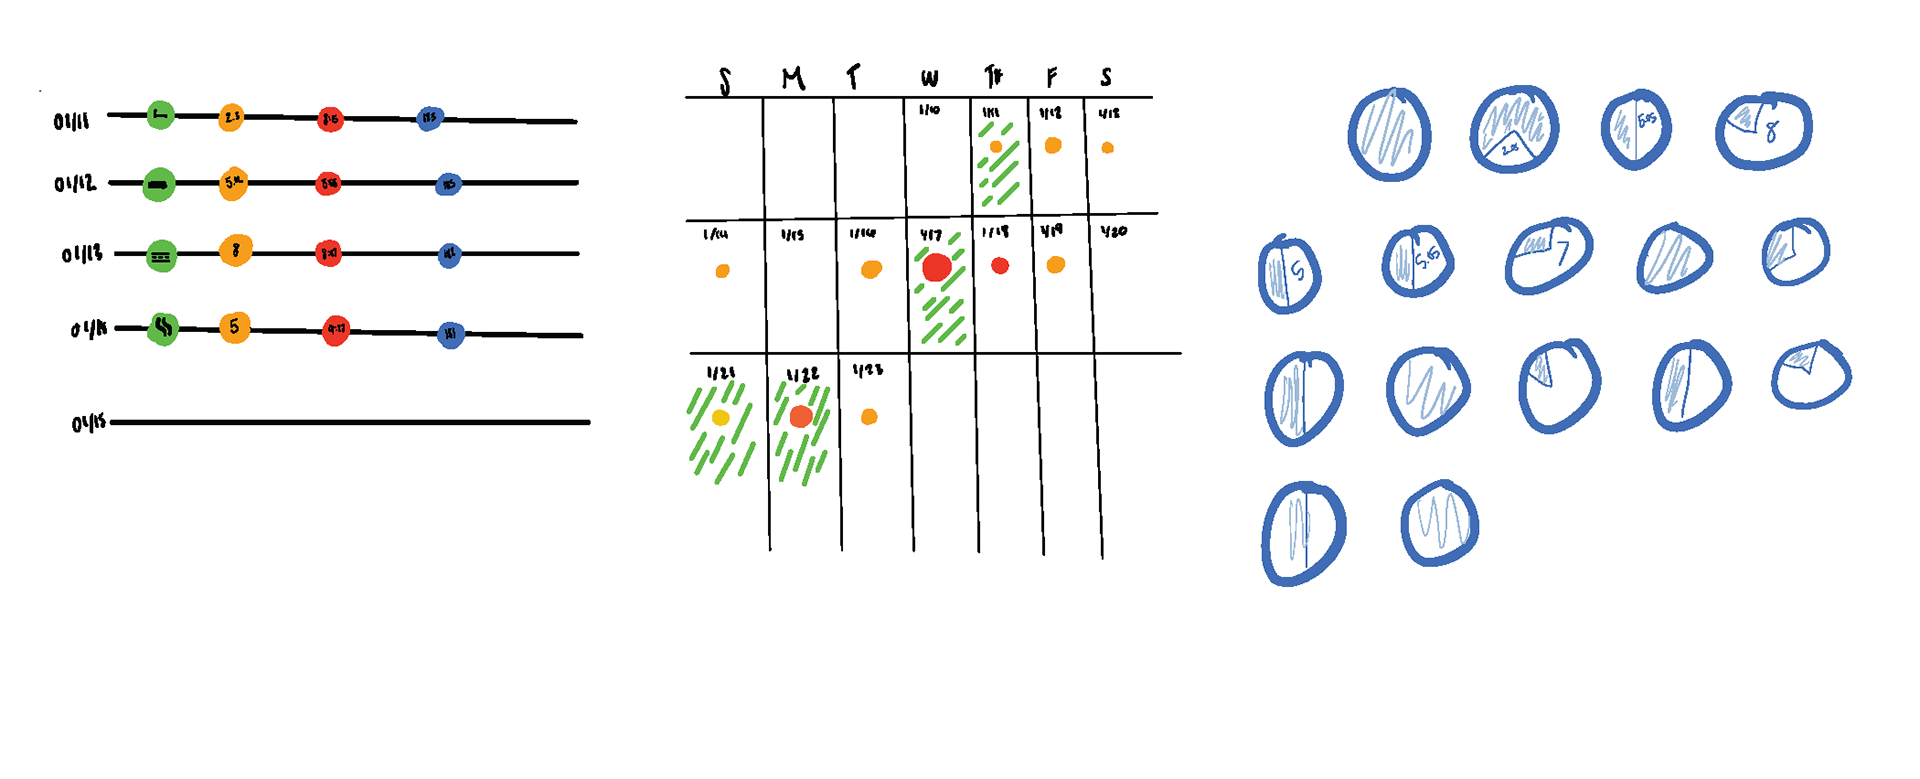
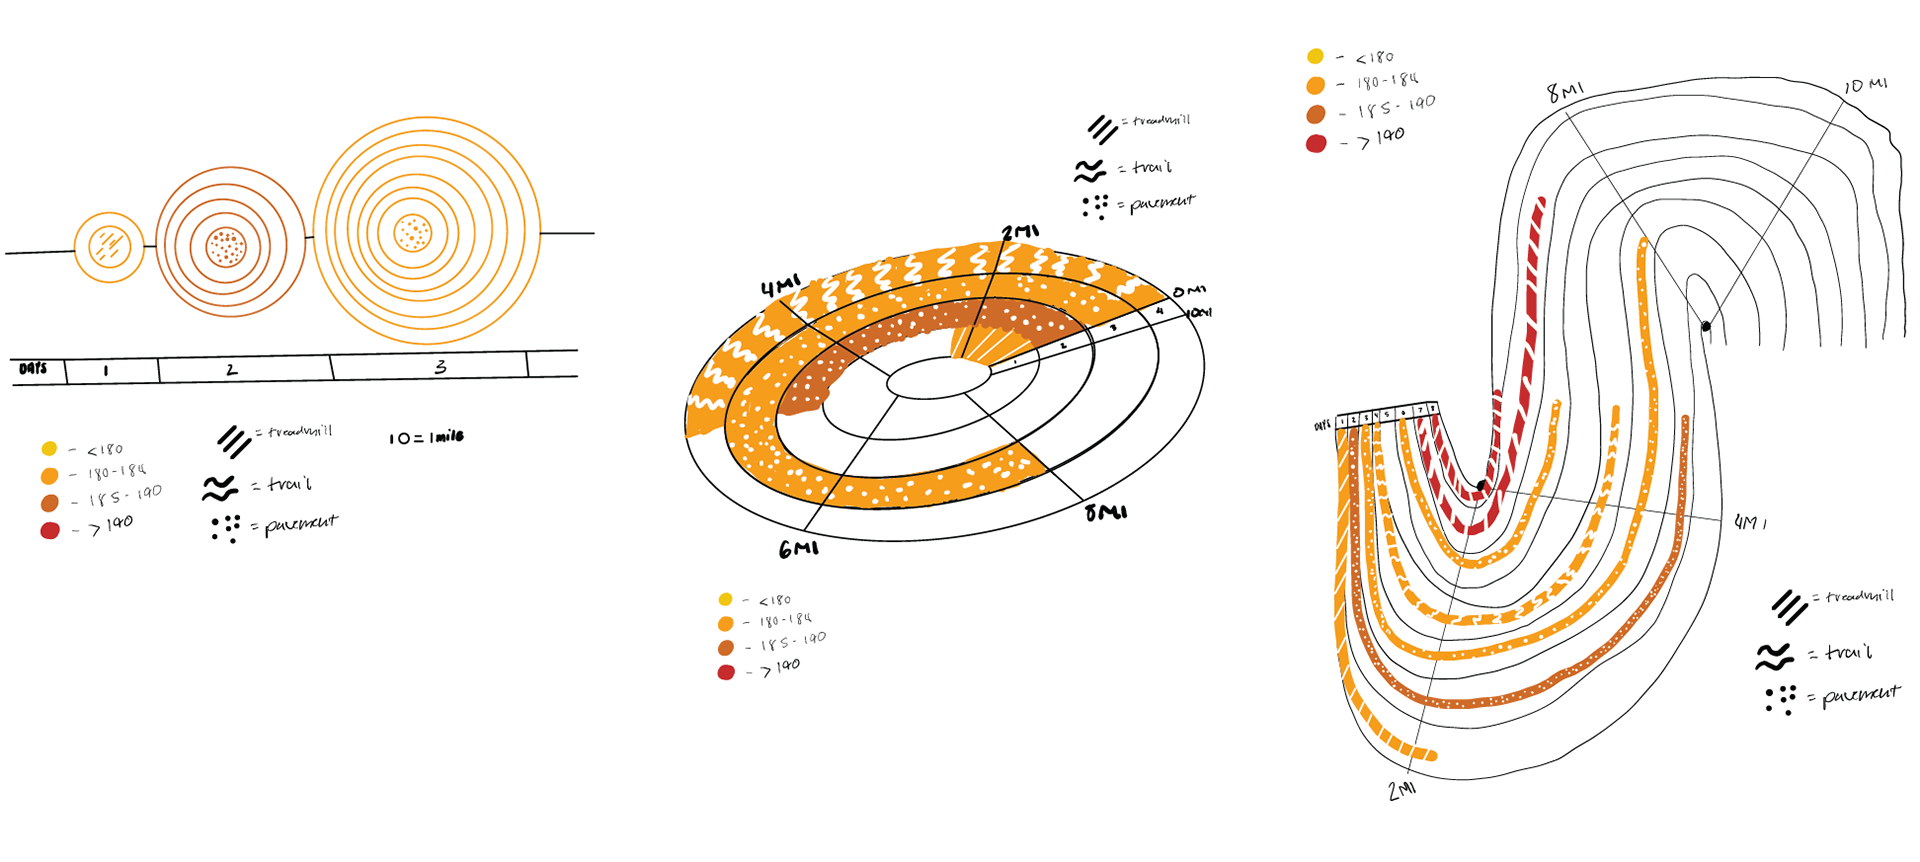
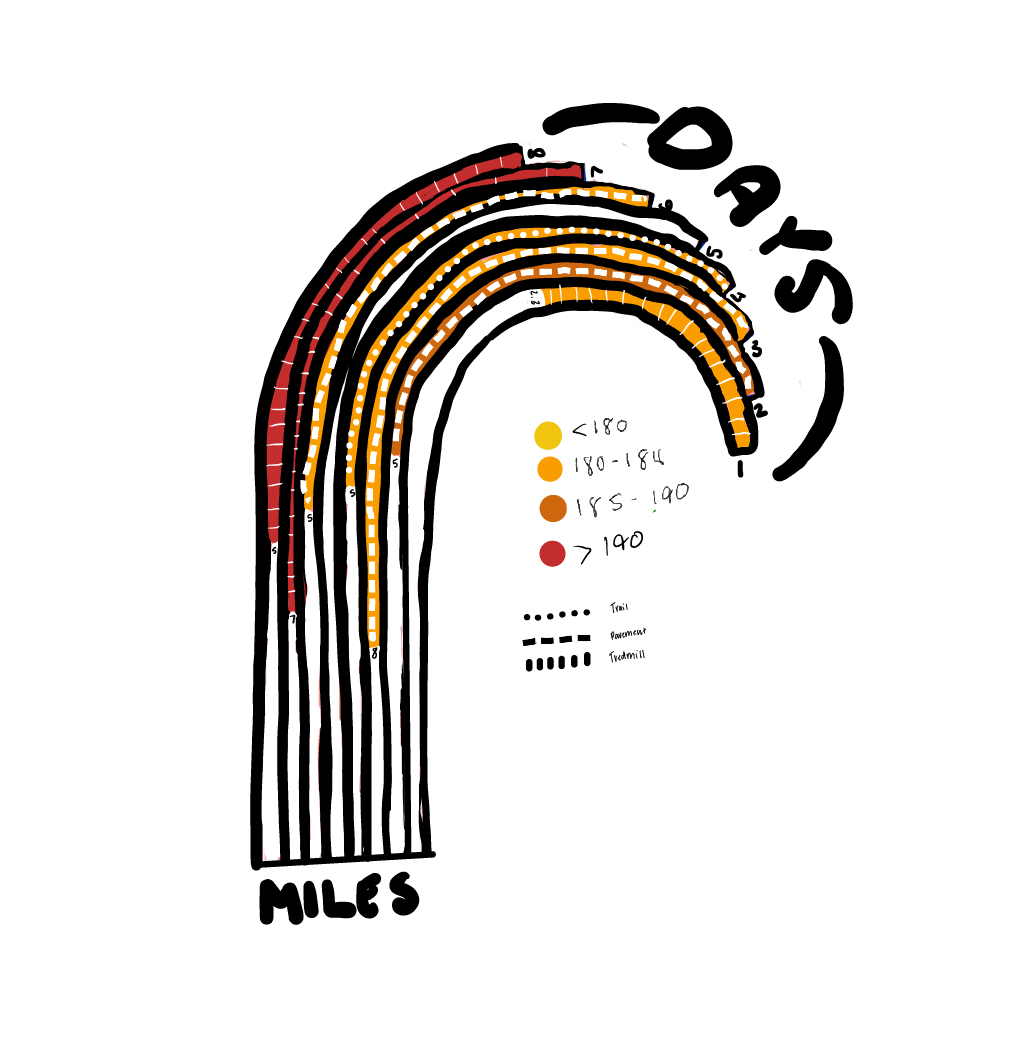
Refined Sketches
Selected and combined different elements from each thumbnail sketches and refined them into more detailed sketches. This stage is helped me to flesh out ideas and explore different variations.
Final Sketch
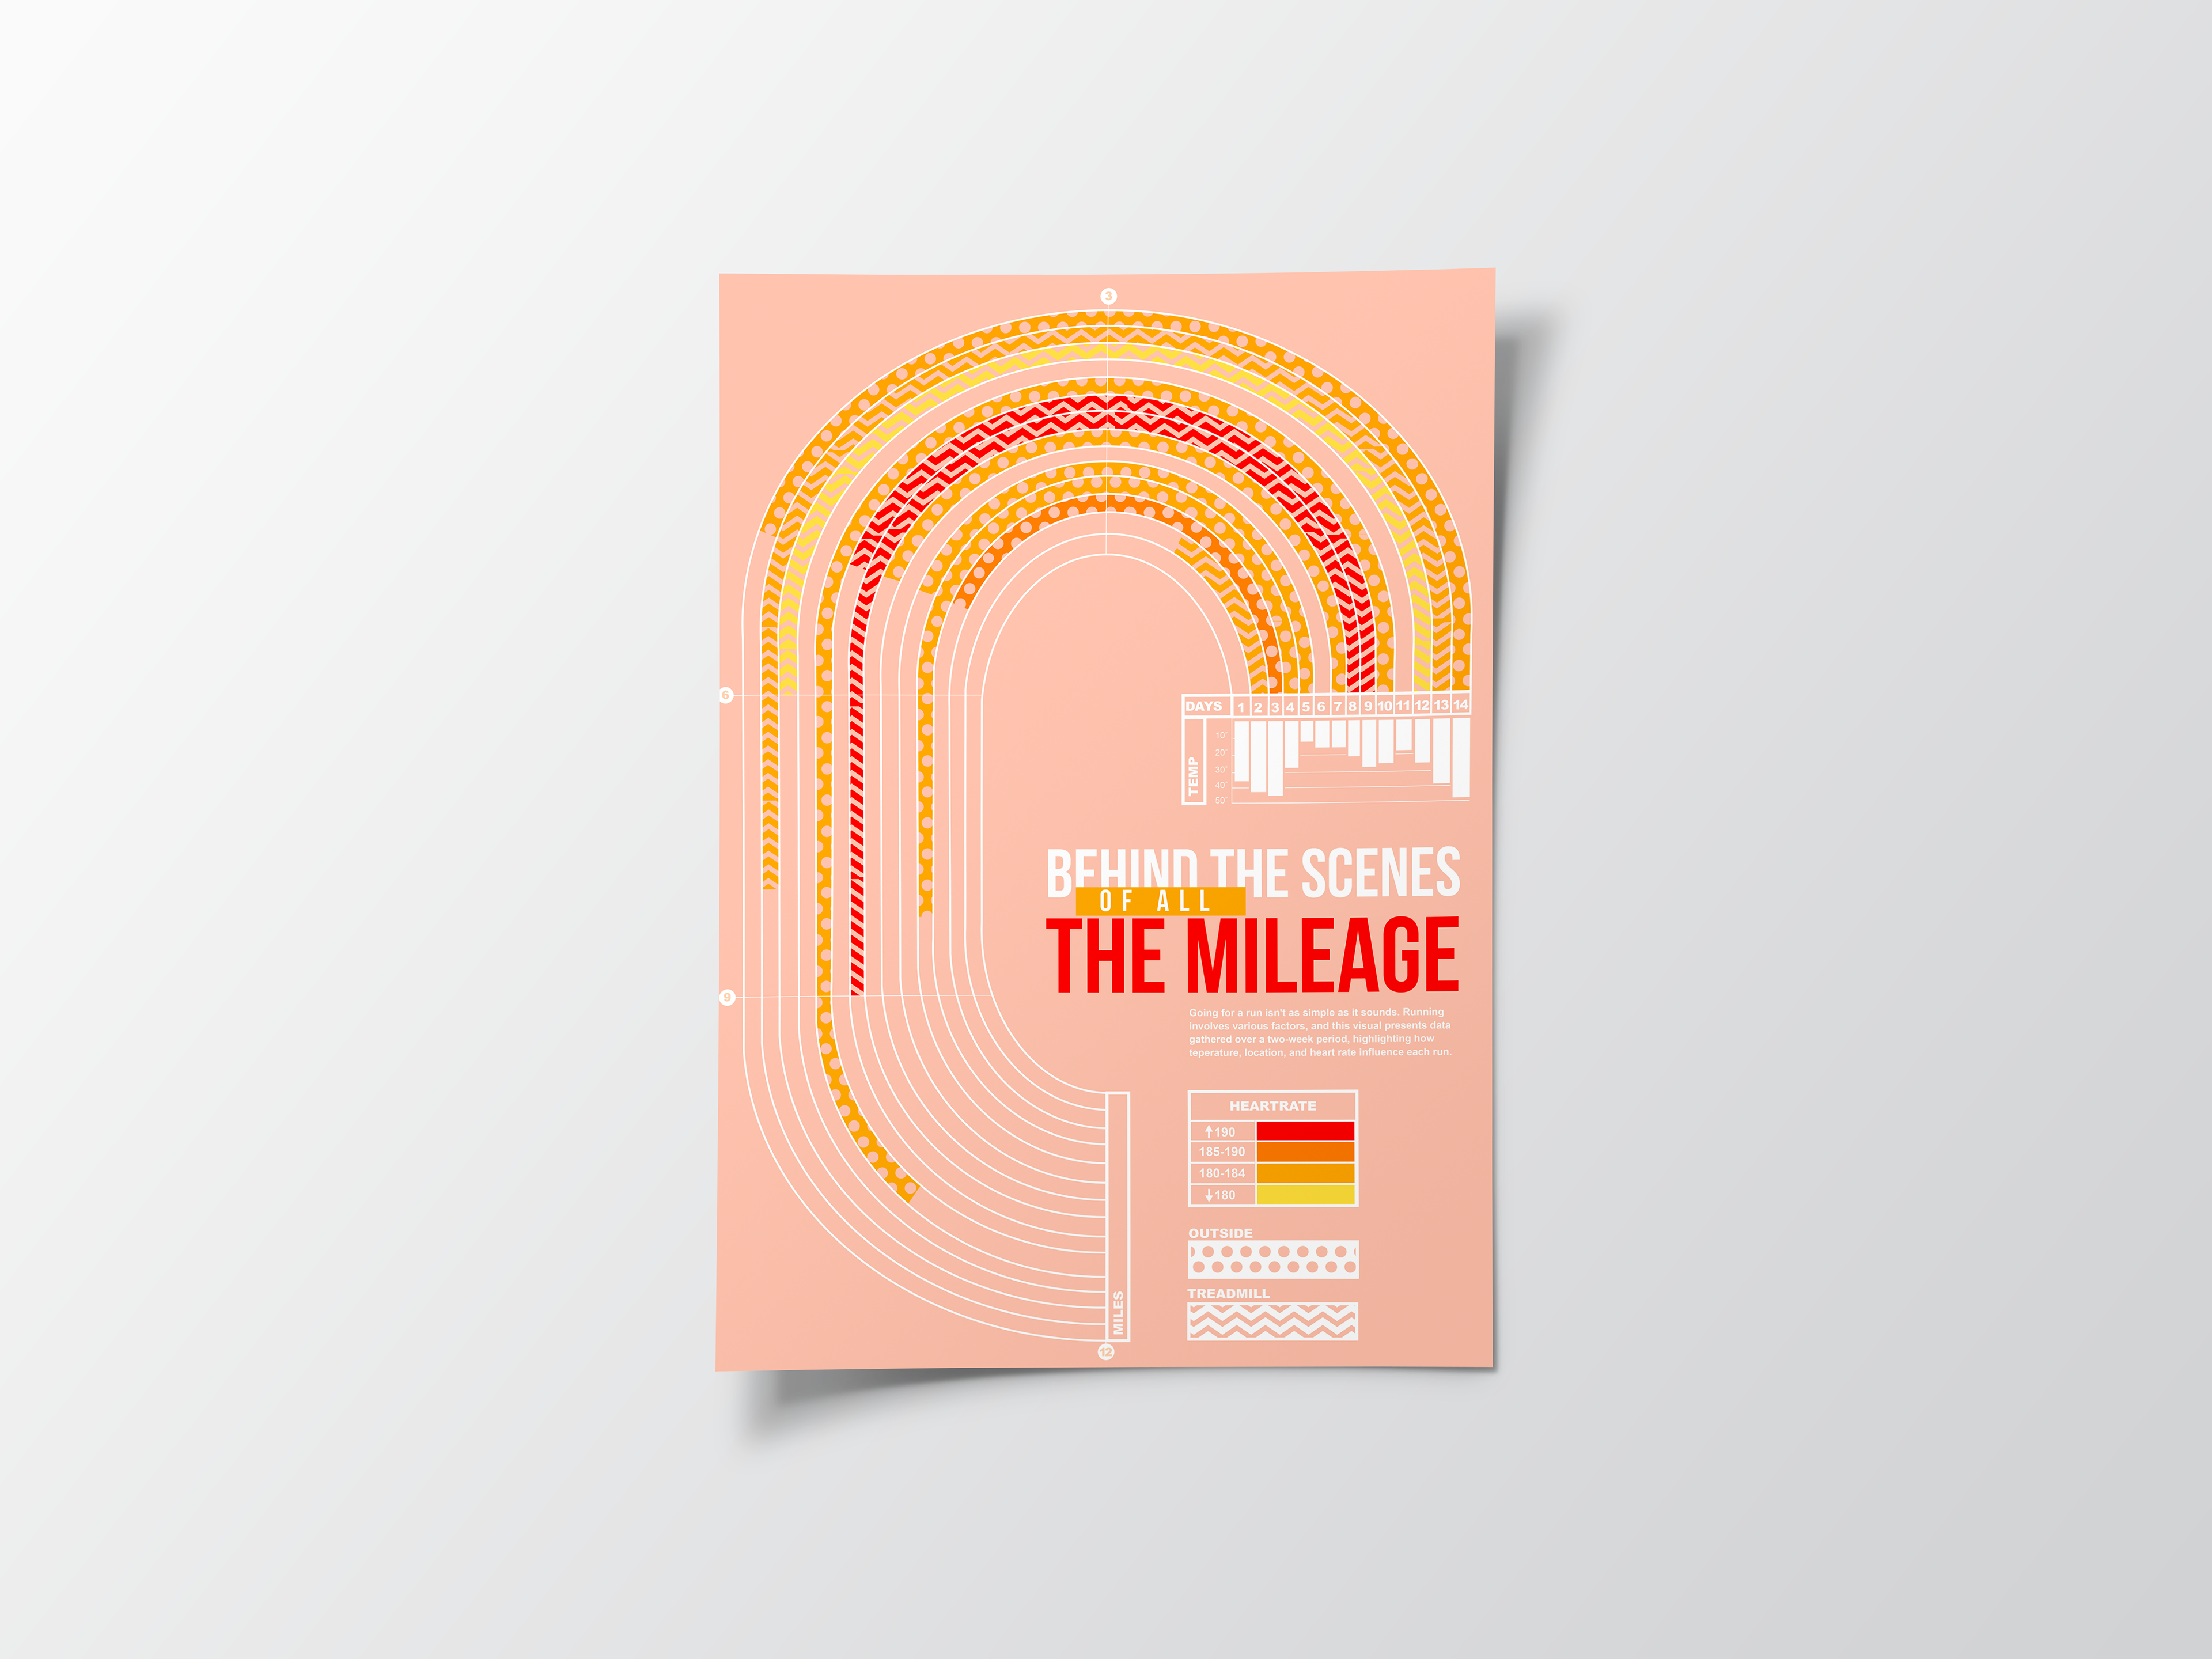
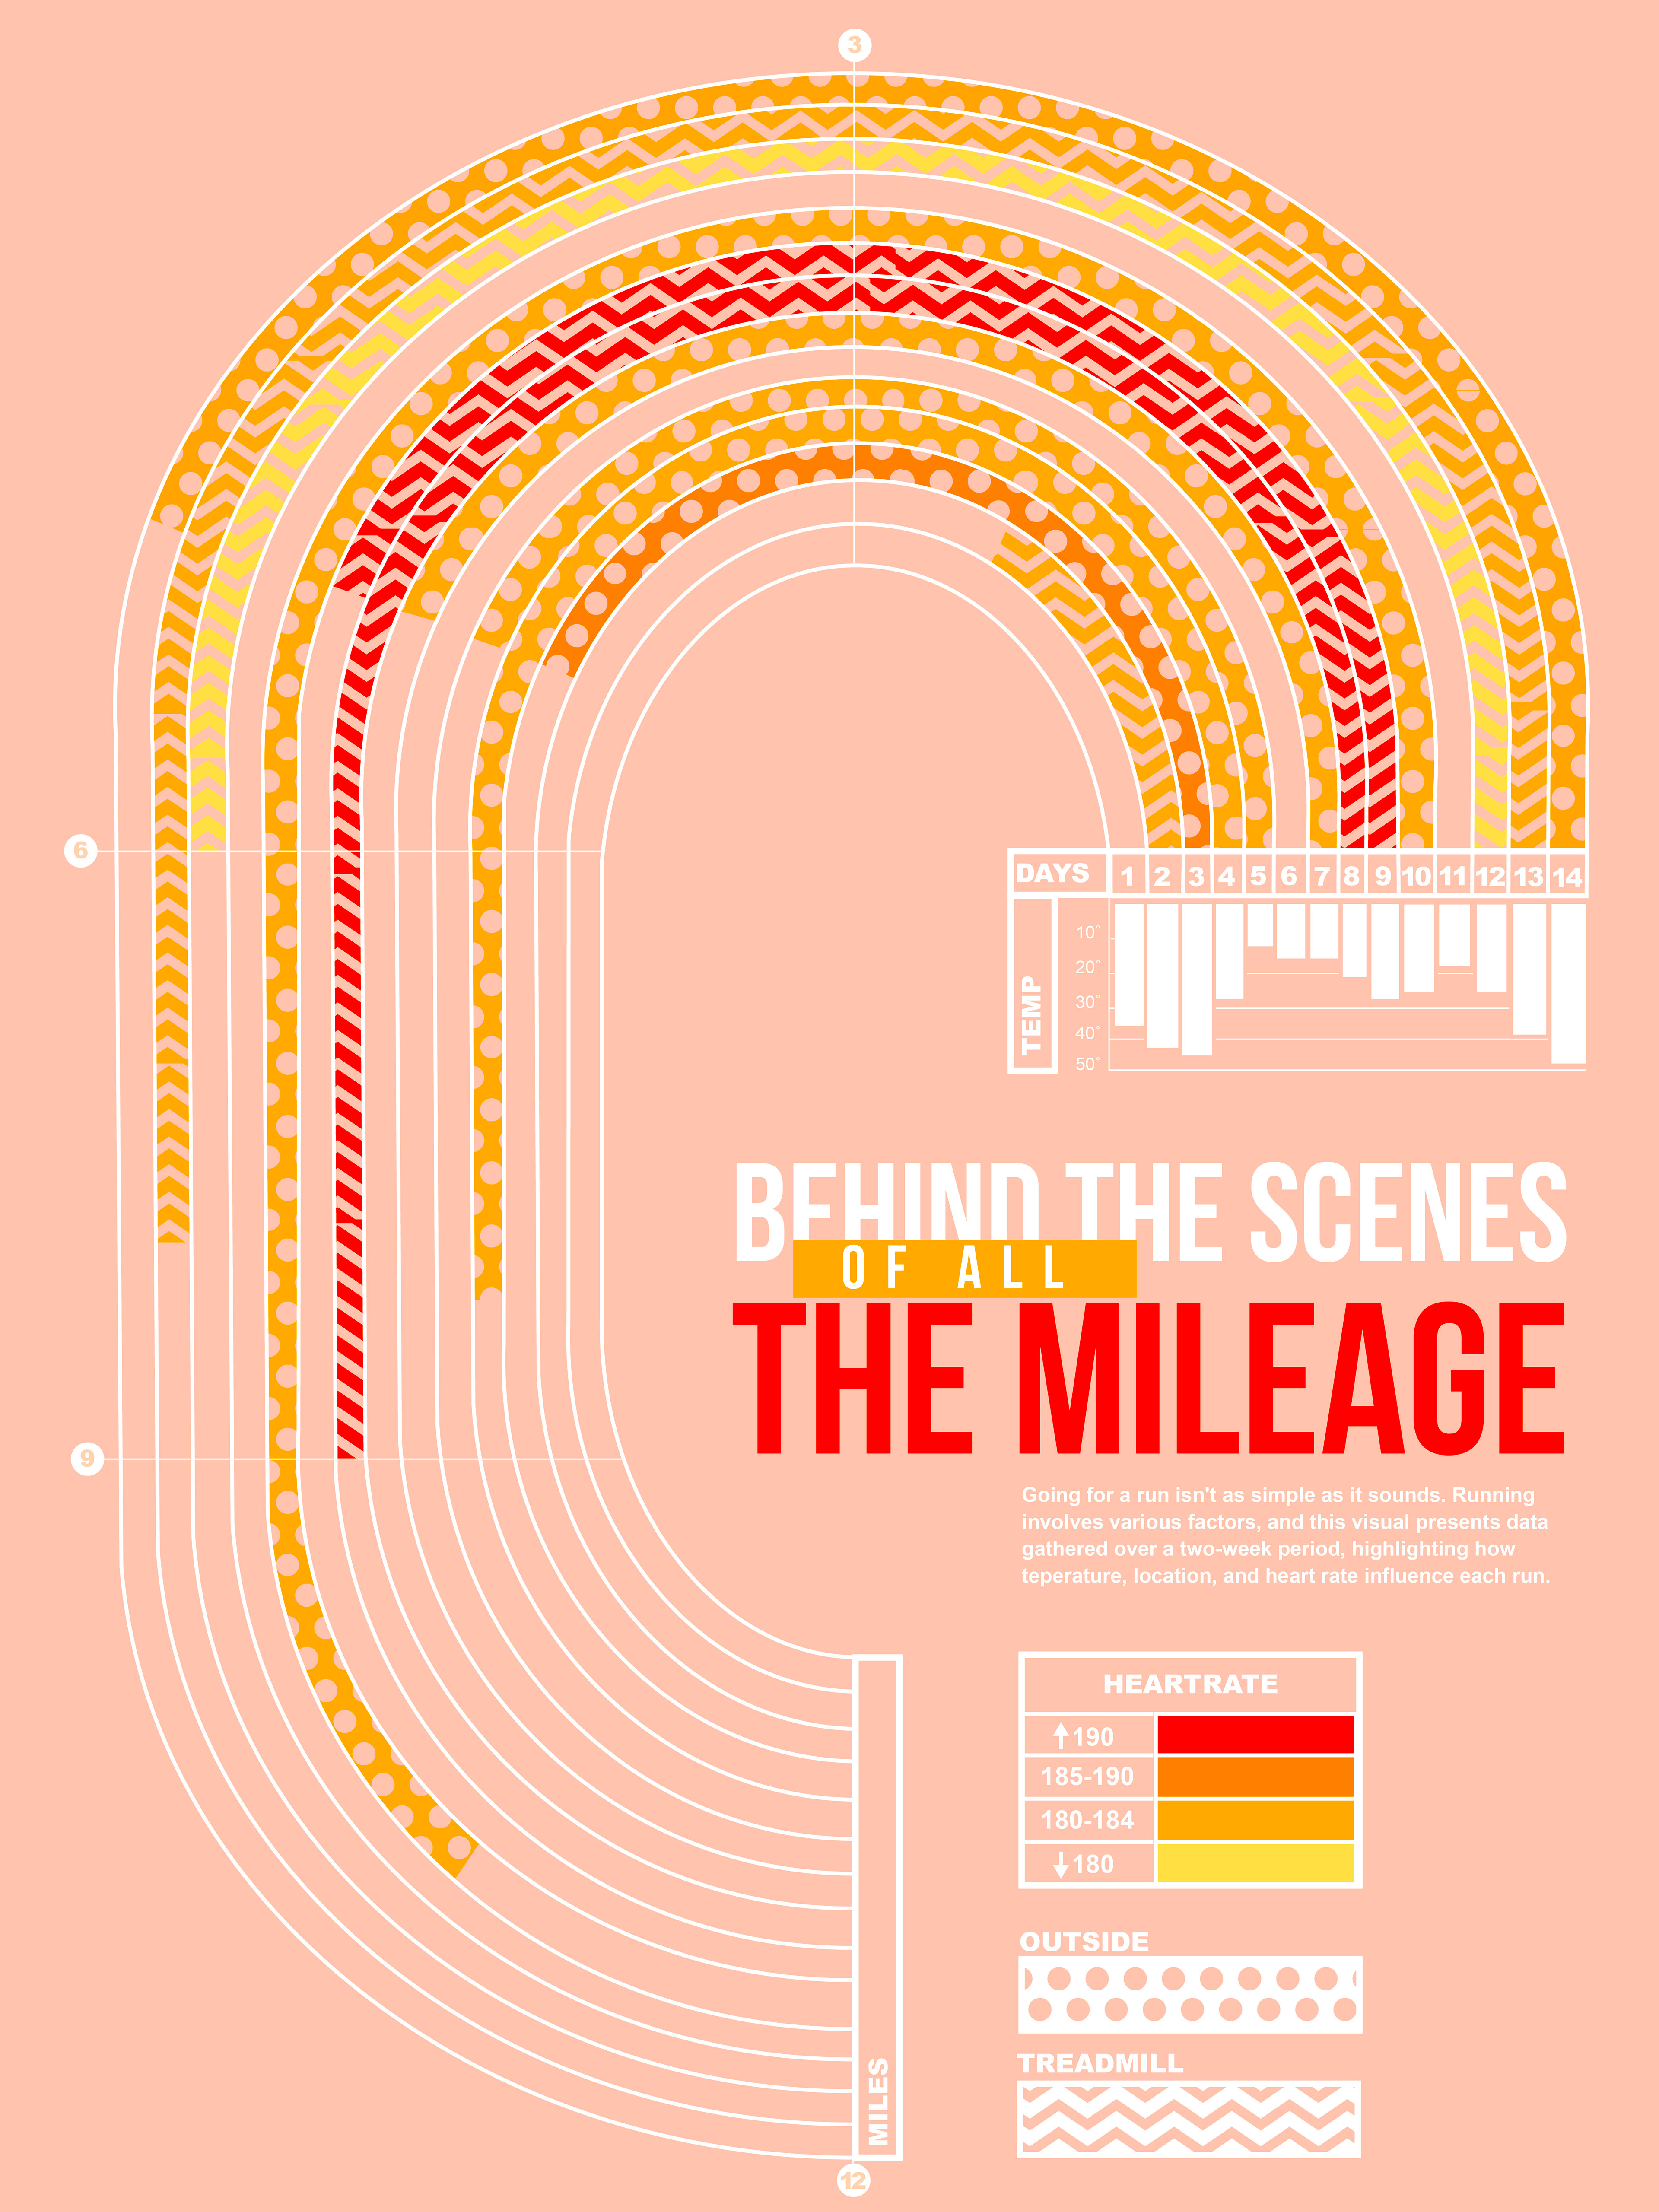
Refined and combined the three sketches to come to my final sketch before I took it digital. I decided on a track like structure to present my data which I found very practical and visually pleasing.
Two design elements I prioritized were Texture and Color. The sketching process enabled me to make decisions without getting bogged down in excessive detail.
I shared my sketches with classmates and the professor to gather feedback. This point in the design process was extremely helpful to get feedback to help me refine.
Digital Iterations
After I had a concept chosen, I created it in adobe illustrator. Iteration after iteration it became a more polished and finished version of my sketch. These mockups provide a more accurate representation of how the final product looks and I was able to go through a refinement process by continuous research and feedback from my peers.
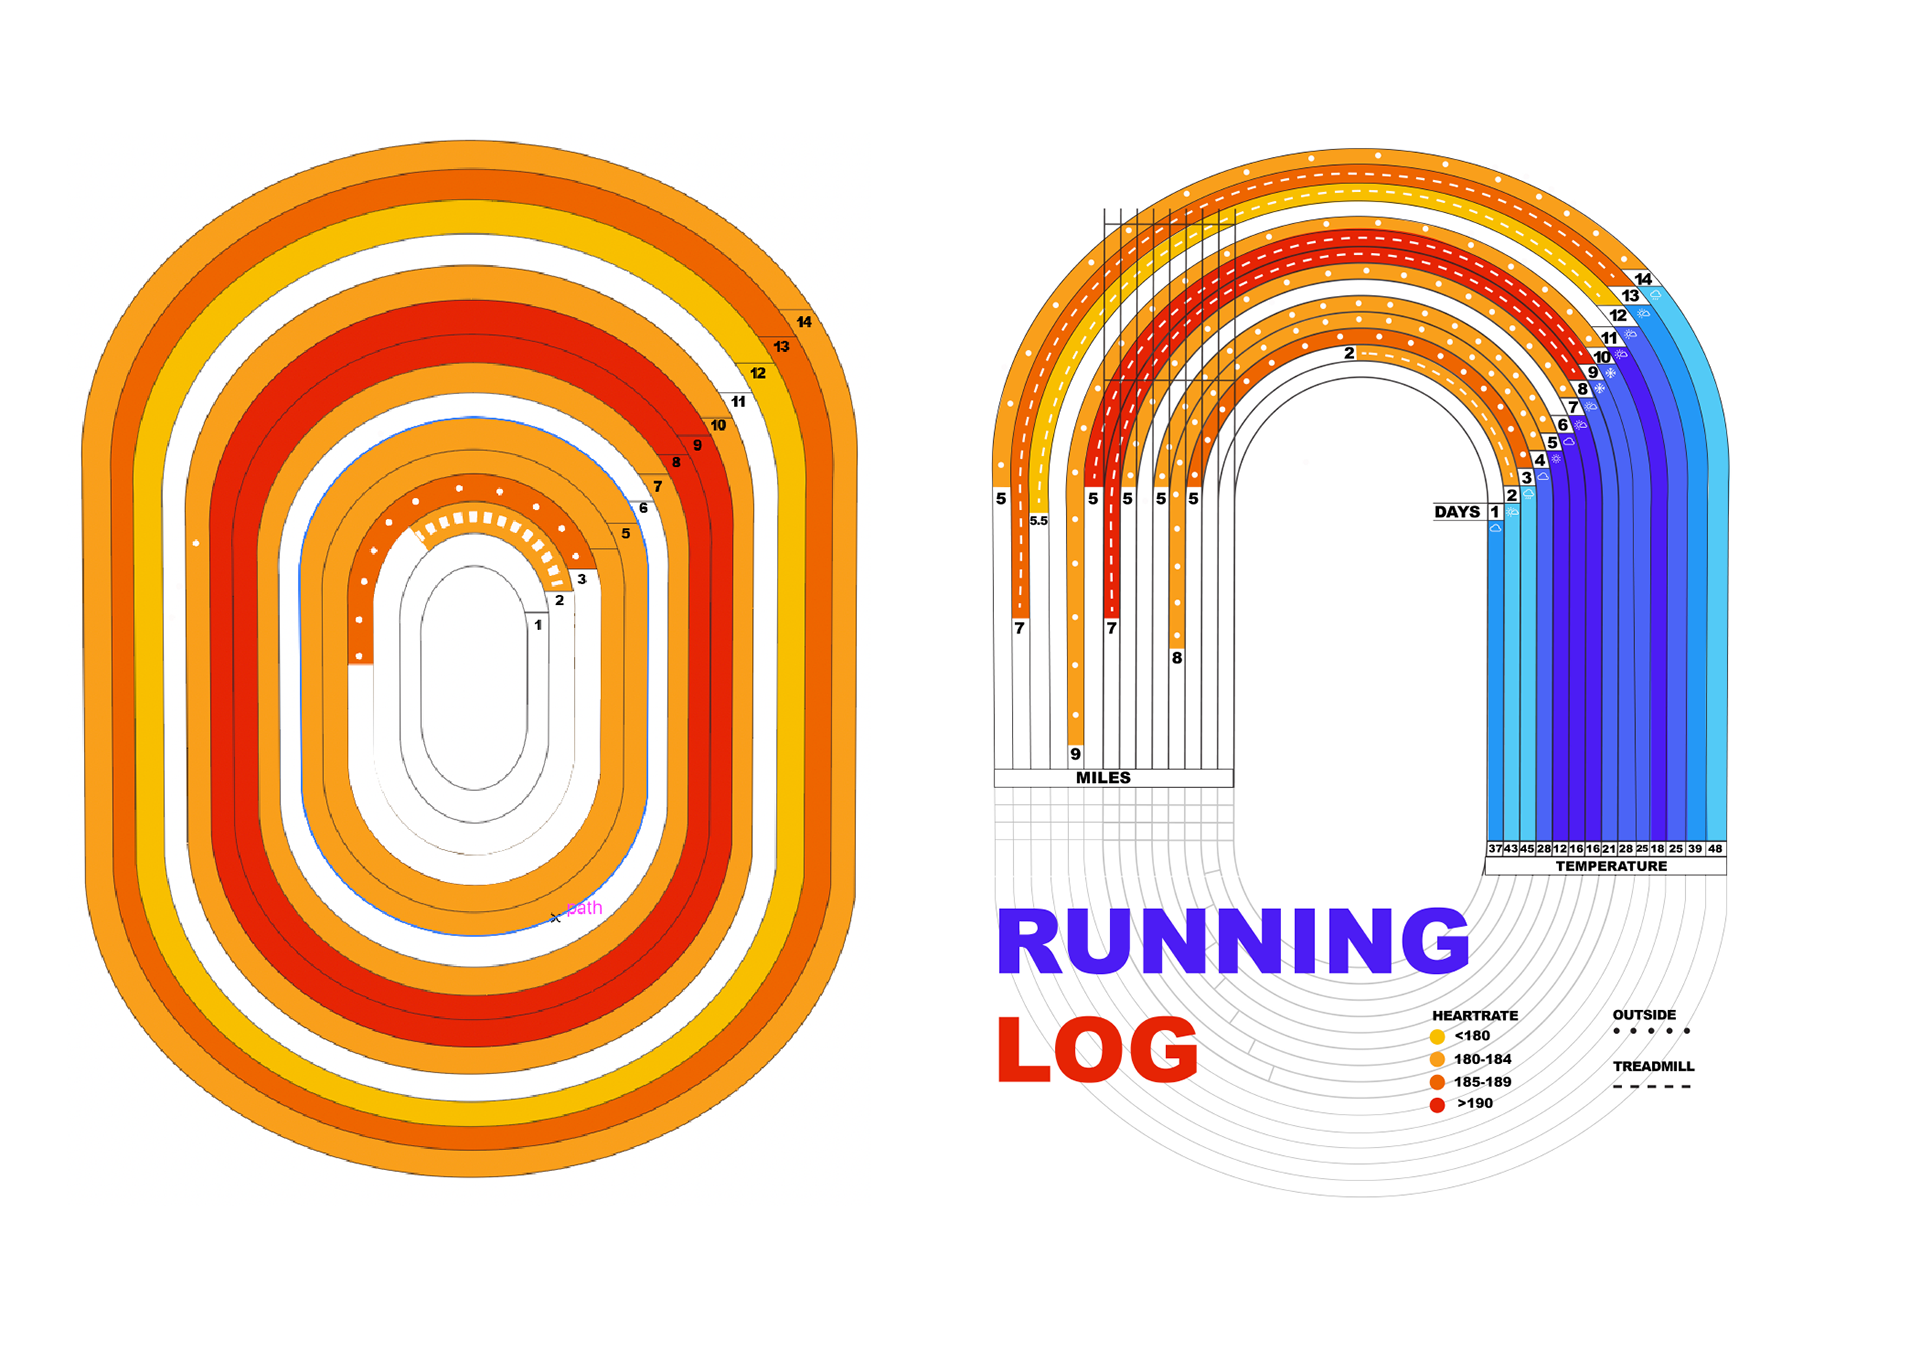
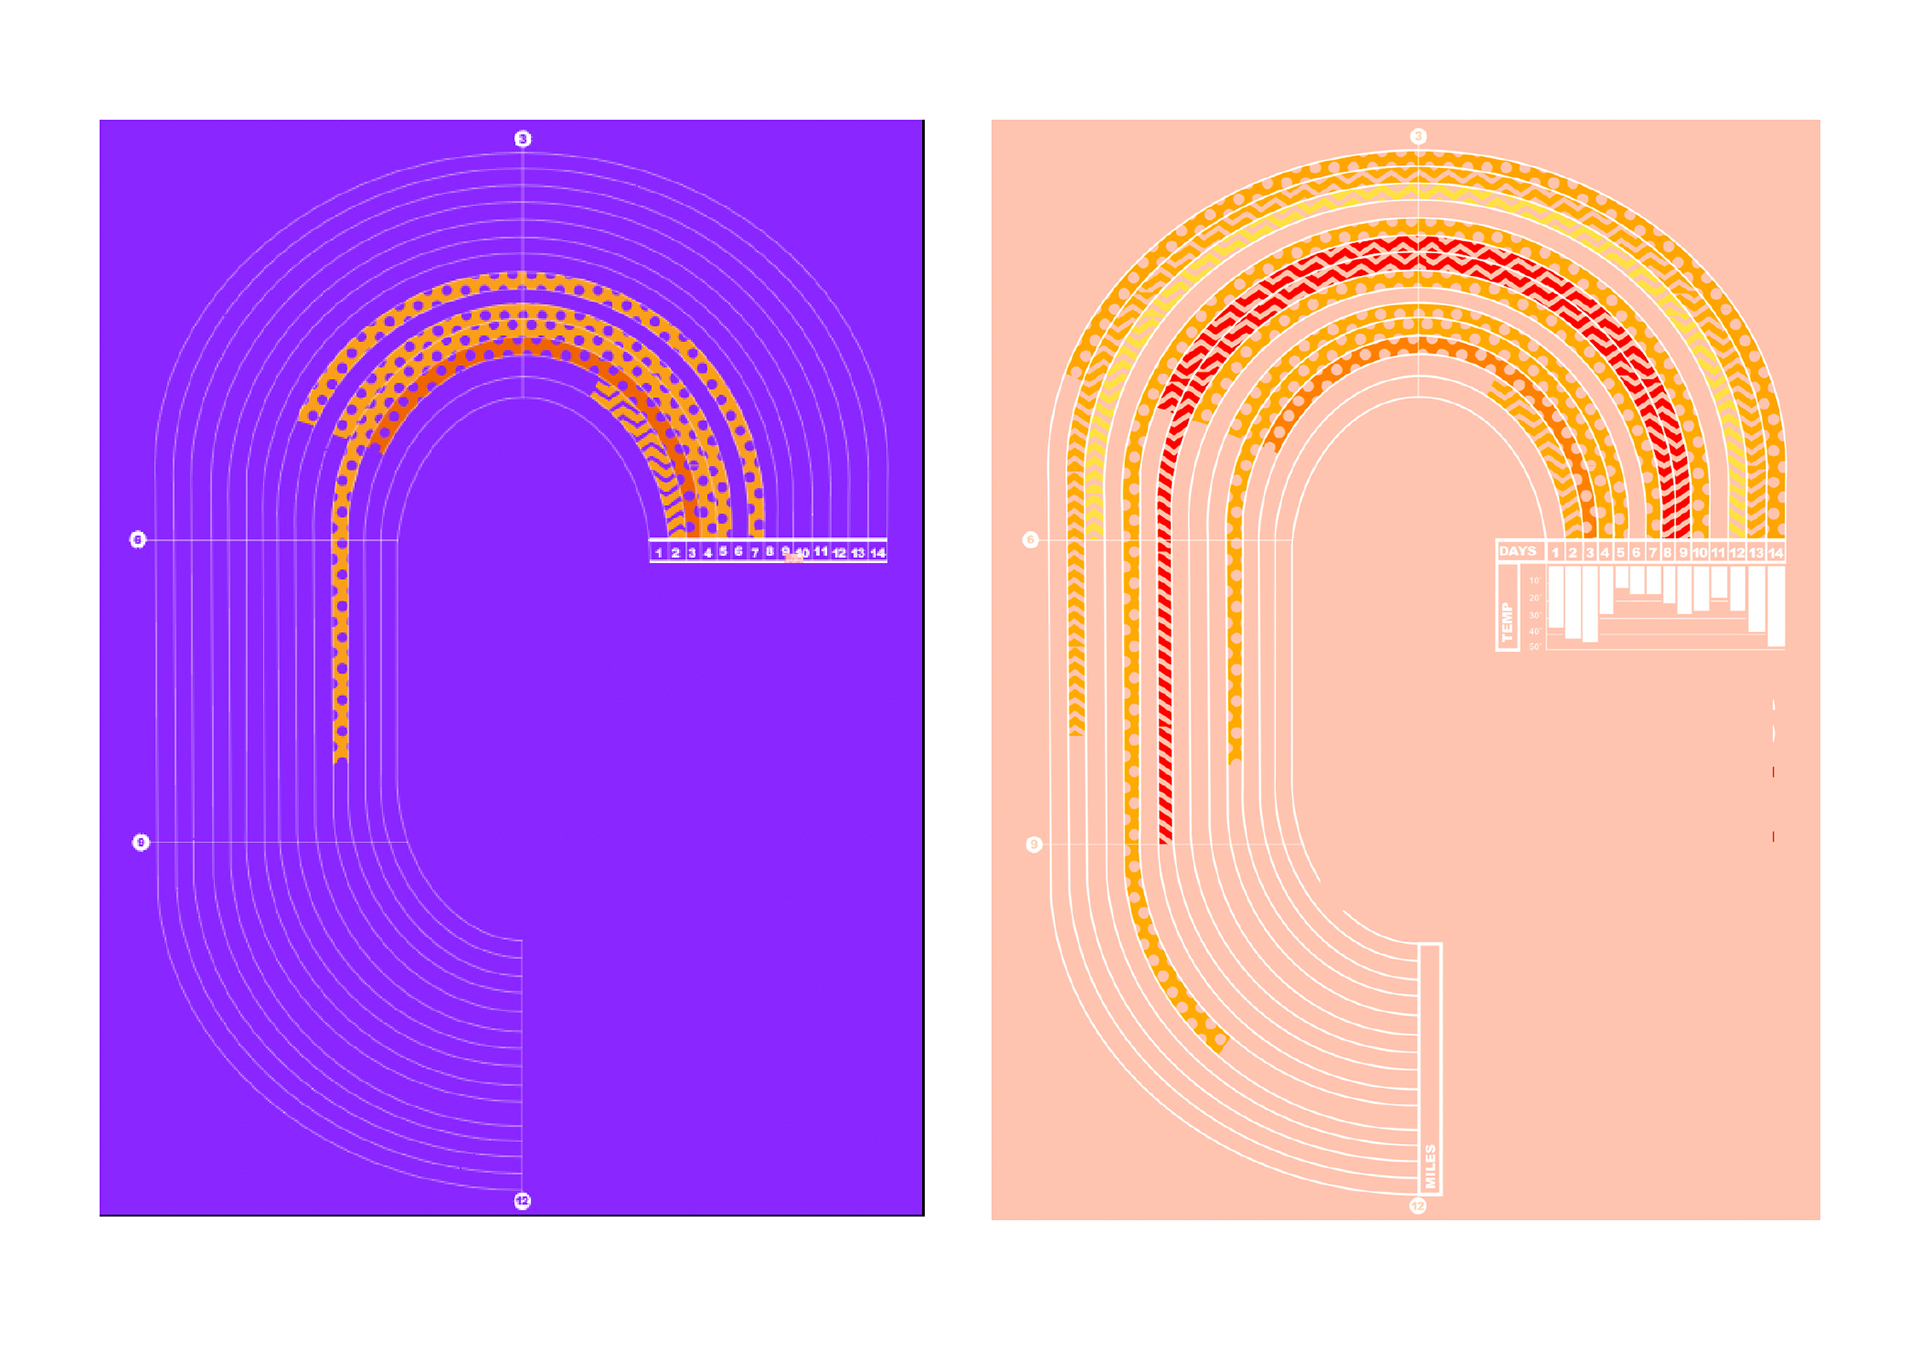
Final Design
For the majority of the process, I maintained my visual representation of the data as a track. But I needed to decide how to seamlessly integrate all the data into this structure in a visually appealing and effective manner. As I polished my work, I reduced the number of colors, enlarged the visual, and refined the pattern, legend, and weather representation. These enhancements elevated the data presentation to the next level.
Reflection
Challenges
The early phases of acquainting myself with visualization techniques were undeniably challenging. It felt like stepping into unfamiliar territory, with the concept seeming entirely new and somewhat daunting. However, I approached this learning curve with determination and an open mind, recognizing it as an opportunity for growth. Through persistence and experimentation, I gradually gained a better understanding of visualization principles and techniques, ultimately overcoming the initial hurdles.
Learnings
I acquired a deep understanding of effectively communicating data in a visually captivating manner. This experience significantly enhanced my skills in visual communication, providing me with valuable insights into crafting compelling and impactful visual representations.
Future Directions
Mastering the ability to analyze data and translate it into visual representations has been a valuable skill I gained through this project. I am confident that this skill will serve me well in future professional endeavors, as it allows me to effectively convey complex information in a clear and engaging manner.